Why Domain‑Level Analytics Change the Game for Agencies
Agencies don’t manage “pages”; they manage portfolios. Dozens of domains, stakeholders, and KPIs collide with limited time. The result is fragmented tools, siloed metrics, and reporting that never quite tells the same story twice.
When performance is viewed only in pieces, you miss patterns that live across templates, sections, and markets. You also burn hours stitching spreadsheets, revalidating numbers, and defending inconsistent definitions.
Shift to domain-level analytics and you compress cycles from analysis to action. A unified, rollup view surfaces portfolio‑wide risks and opportunities, enables truly centralized reporting, and turns “What happened?” into “What we’ll do next.” Executives get a consistent narrative, while practitioners get clarity on priorities—without replatforming or abandoning the tools already working at the channel level.
What Are Domain‑Level Analytics, Exactly?
Domain-level analytics roll up performance across the entire site—every template, section, and directory—so you see how the domain is gaining or losing ground overall, not just at a URL.
Key metrics at this scope include:
- Overall search visibility and share of voice by query clusters.
- Indexation, crawl efficiency, and technical SEO health across major templates.
- Content gaps, topical authority, and internal linking breadth.
- Conversion quality by landing page groups and intent segments.
- Cross-domain comparisons for multi-domain SEO portfolios.
Tools help here: Google Search Console’s domain properties consolidate signals across subdomains, and GA4’s roll‑up reporting offers portfolio views—ideas we bring together in one agency dashboard.
Why Page‑Level Metrics and Ad‑Hoc Reports Break Down
Page-centric dashboards excel at micro diagnostics, but they blur the macro. Template-level regressions, sitewide cannibalization, and section dilution hide in aggregate unless you analyze the domain as a system.
Ad hoc reporting magnifies the problem. Each custom deck tweaks definitions, cherry-picks time windows, and resets baselines. The narrative drifts, stakeholders lose context, and executive decisions slow because nobody trusts the “source of truth.”
With domain-level analytics, patterns emerge quickly: a template bleeding click-through, a content cluster underperforming, or internal links starving a high-intent directory. You move from debating numbers to prioritizing fixes that matter. And because insights align to the domain, wins scale: one change to a reusable component can lift hundreds of pages without creating another reporting fire drill.
The Agency P&L: Retention, Margins, and Real Scale
When leaders see domain momentum, they connect SEO to outcomes. Visibility lifts on revenue-driving clusters, branded demand compounds, and conversions trend with content investment. That clarity improves renewals and expands scope without escalation.
Margins follow. Standardized, domain-level KPIs mean less manual QA, faster variance detection, and predictable handoffs between strategists, writers, and developers. Your team spends more time fixing issues than debating which report is “right.”
Scale becomes achievable. Rollup dashboards compare accounts by vertical and tier, enabling repeatable playbooks for enterprise versus SMB. Shared definitions, reusable snapshot reports, and templated strategic roadmaps keep execution focused—and profitable.
Measurable gains your clients (and finance team) will notice
Expect concrete gains in both client reporting and delivery:
- Time to executive-ready updates drops from hours to minutes.
- Fewer “what changed?” meetings; more roadmap reviews and approvals.
- Higher content hit rate via cluster-level briefs and QA.
- Reduced rework as template fixes cascade across sections.
- Health alerts prevent traffic dips from becoming churn risks.
Use Snapshot Reports and Domain Rollups to Set Strategy Faster
Snapshot reports give you a clean baseline. In one view, benchmark visibility, indexation, and technical health; flag content gaps; and tie priority keywords to revenue pages. Because the scope is the domain, the story is consistent across stakeholders.
Roll up snapshots across clients to spot patterns by vertical, site size, or monetization model. That portfolio view reveals which levers typically move fastest—technical fixes in enterprise, cluster expansion in SMB—and informs staffing.
Practical ways to use rollup dashboards:
- Rank clients by opportunity score and assign sprint themes.
- Compare template health to target systemic fixes that scale.
- Detect cross-account wins to templatize briefs and QA checks.
- Monitor seasonality across markets to time launches and rebalances.
Because snapshots are standardized, your client reporting gets faster too. You can reuse the same panels in executive decks, swap in only the domain, and maintain a single narrative from monthly reviews to mid-sprint updates. See our Snapshot Reports for examples.
From One Dashboard to a 90‑Day Strategic Roadmap
Start with the domain rollup, then cascade priority into a 90‑day plan. Translate patterns into discrete work: fix crawling on a brittle template, expand three content clusters, and secure links to shore up authority.
What goes into a 90‑day SEO roadmap?
- Technical: indexation, Core Web Vitals, internal linking, sitemap hygiene.
- Content: cluster briefs, intent mapping, refreshes for decaying winners. See our notes on content clusters.
- Off-page: digital PR targets, partner mentions, and reclaimable links.
- Measurement: goals, KPI definitions, and QA checkpoints by sprint.
Keep status updates ritualized and short. Every executive-ready check-in should highlight goals, progress against baselines, blockers, and next actions—pulling directly from the same centralized reporting your team uses day to day.
Crucially, map work to business outcomes. Tie each sprint to conversion lift, assisted revenue, or qualified lead volume, and document the hypothesis so results read as proof—not just activity—when leadership scans the deck.
How Sage SEO Brings Domain‑Level Analytics to One Place
Sage SEO centralizes agency analytics. From a single dashboard, unify snapshot reports, Search Console and GA4 signals, and content insights into domain-level analytics that make prioritization obvious and executive updates painless. Rollup dashboards surface domain properties side by side, so patterns across brands or regions are obvious without exporting data.
Differentiators built for multi-domain SEO:
- Intuitive client rollups with cross-account comparisons and alerts.
- Roadmap generation that converts findings into sequenced sprints.
- Agency-ready templates for reporting, briefs, and QA.
- Seamless links to your existing tools—no rip-and-replace.
Related resources: Domain‑Level Analytics, Snapshot Reports, Strategic Roadmaps, Agency Solutions, Pricing, and Case Studies. Many teams still call us “SEO Sage”; either way, the platform is built for clarity and speed.
Your First 30 Days: Baselines, KPIs, and Quick Wins to Prove It
Establish baselines in Sage SEO: domain visibility, cluster performance, crawl health, and conversion quality. Choose KPIs that match business models—lead volume, assisted revenue, or qualified demo starts—so client reporting reads as outcomes. See guidance on KPI selection.
In weeks 1–4, prioritize quick wins:
- Fix discoverability: sitemap issues, noindex mishaps, thin template titles.
- Refresh decaying winners and fill one high-value content gap per cluster.
- Add internal links to rescue orphaned high-intent pages.
Then set light automation: snapshot schedules, alert thresholds, and a recurring executive summary every month pulled from the same dashboard.
Share this
Related Posts
-
Connecting Google Analytics to Squarespace: Troubleshooting and Pro Tips
Most Squarespace users discover the problem the same way: they log into Google Analytics weeks after “setting it up,” expect a tidy dashboard of buyer behavio
-
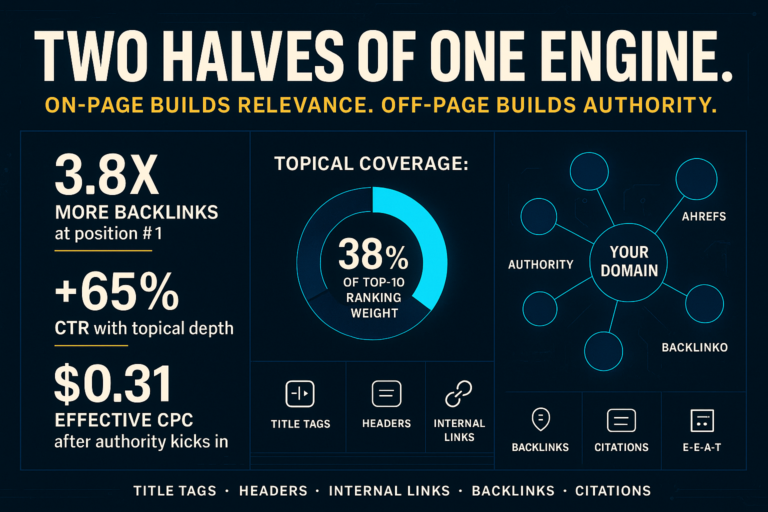
Comprehensive Guide to On-Page and Off-Page SEO
Here’s the uncomfortable truth most SEO guides bury: the #1 result in Google has an average of 3.
-
AI-Powered Content Marketing: Tactics That Deliver 90-Day Wins
Key Takeaways Precision targeting beats volume for fast AI content wins Refresh page-2 posts before…