

- Monthly reporting decks cost roughly 2 hours per client.
- Clients consistently reference only the directional trendline chart.
- Live score history eliminates formatting work without losing strategy.
- Trust increases when clients see the same raw data you see.
- New clients may still need brief written context alongside the trendline.
Last Sunday of the month, 9 p.m., and I’m tabbing between Google Search Console, a spreadsheet of keyword positions, and a slide template I’d copy-pasted so many times the footer still said “Q3” in Q1. I did this for every retainer client, every single month, for the better part of six years. Then one afternoon a client asked me a question on a call that made the whole ritual look ridiculous: “Can you just show me the number going up?”
That question is the entire premise of this article. I stopped building the deck. I started showing the trendline. Here’s exactly how that happened, and why I think most freelance SEOs and small agency owners are still wasting a weekend night a month on a deliverable nobody reads past the first chart.
The Monthly Reporting Ritual I Dreaded (And Why I Kept Doing It Anyway)
The old ritual cost me roughly two hours per client, every single month, and most of that time built slides nobody actually read. I’d export ranking screenshots, pull the audit score, drop both into a slide template, write three bullet points of “what we did this month,” format a trendline chart by hand, and export to PDF. Multiply that by six or eight retainer accounts and you’ve eaten an entire evening.
Here’s the part I’ll admit I didn’t say out loud back then: some of that deck-building wasn’t really for the client. It was for me. A polished PDF with a methodology slide felt like proof I’d earned the retainer fee that month, even on the slow months when the real work was just steady maintenance. I was building a report to justify my own invoice, not because the client needed it.
Here’s roughly where that time went, broken down from my own habit at the time:
| Task | Approx. time per client | Did the client ever reference this part? |
|---|---|---|
| Pulling rankings & screenshots | 25 min | Rarely |
| Exporting and formatting the audit score | 20 min | Occasionally |
| Writing the “what we did” narrative bullets | 30 min | Almost never |
| Building the trendline chart by hand | 25 min | Always |
| Formatting, exporting PDF, writing the email | 20 min | N/A (delivery) |
Look at that last column. One line item got attention every time. The other four were theater.
What Do Clients Actually Want From an SEO Report?
Clients want to know if the number is moving in the right direction, and almost nothing else survives the first thirty seconds of a reporting call. I started paying closer attention to what people actually did during our monthly calls instead of what I assumed they wanted. The pattern was consistent across a B2B SaaS client, an e-commerce brand, and a regional service business I managed at the same time: they’d scroll past the audit detail, skim the bullet points, and land on one question.
“So are we moving up or not?”
That’s not a cynical take on clients being disengaged. It’s a reasonable response to how trust actually works in a service relationship. Clients hired me to think about rankings so they don’t have to. Asking them to read a methodology slide every month is asking them to do the job they’re paying me to do. This pattern isn’t unique to SEO, either — it shows up across marketing retainers generally, wherever an agency builds a narrative deck around a number the client could see directly.
- They want to know direction: up, down, or flat.
- They want confidence the number isn’t cherry-picked.
- They want a reason for a dip, if there was one.
- They almost never want the methodology behind the number explained in slide form.
What Did Building the Old Deck Actually Involve?
The old deck-building workflow was fragile by design: every new client meant a new template, and every missed export meant a late, awkward email. Walk through it with me. Pull rankings from your rank tracker. Pull the audit score from wherever you’d run your last crawl. Paste both into a slide template that drifts slightly from client to client because you tweaked it “just this once” for someone’s branding. Write a summary paragraph that restates what the numbers already show. Export. Send.
The hidden cost wasn’t the hours, it was the fragility
One sick week and three reports went out late. One new client signed and I had to build a fifth template variant from scratch. I once sent a client the wrong month’s deck entirely — same filename convention, wrong file — and spent twenty minutes the next morning writing an apology email instead of doing optimization work. I’ve written about this kind of scar before in the context of rewriting meta titles at scale and watching a manual process quietly break something; reporting decks have the exact same failure mode. Manual, repeated, templated work is where small agencies bleed hours they could spend on client strategy or new business outreach instead.
Skip the spreadsheets. Start Sage SEO free.
See how AI content ops transform your agency workflow in minutes.
How I Switched to Letting Score History Do the Talking
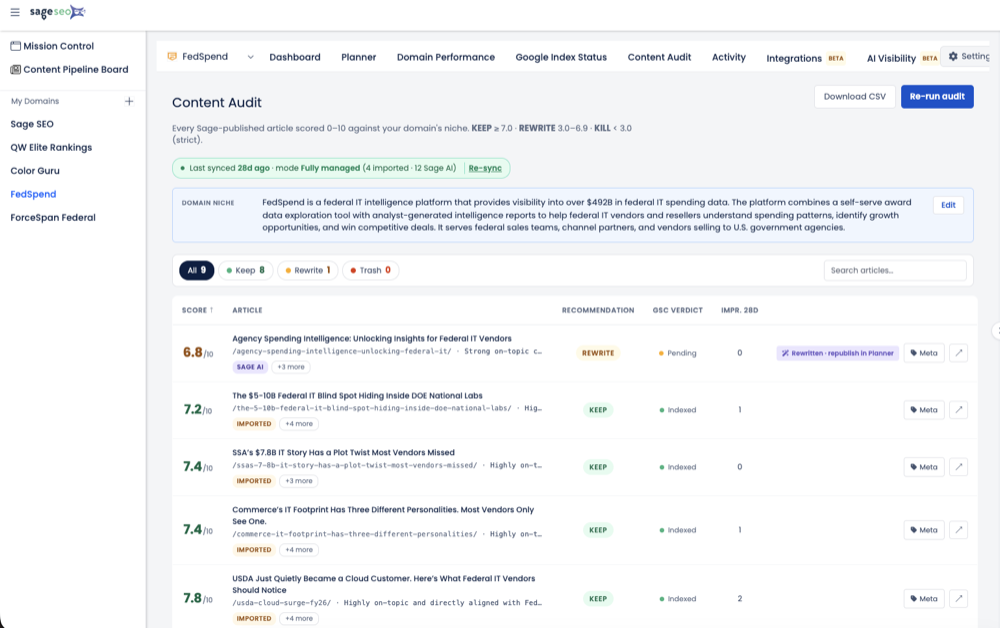
The fix wasn’t a better deck template — it was realizing the deck existed only to build up to a chart the tool already generated automatically. I was running an audit inside Sage SEO for a client and noticed the score history view sitting right there: a running trendline of that client’s score over time, tracked automatically every time a crawl ran. No formatting. No export. No narrative bullets required to make sense of it. It was, almost embarrassingly, the exact chart I’d been hand-building every month.
So I stopped hand-building it. The next reporting call, I logged in, pulled up the momentum view tracking that client’s ranking and score trajectory, and just talked through it live. No deck. No PDF. No two-hour Sunday prep block.
Old workflow versus new workflow, side by side
| Step | Old deck workflow | Score history workflow |
|---|---|---|
| Data pull | Manual export from multiple tools | Already logged automatically |
| Chart building | Hand-formatted each month | Pre-rendered trendline |
| Narrative writing | 30-minute summary paragraph | Spoken live on the call |
| Delivery format | PDF/slide deck via email | Screen-share or short screenshot |
| Prep time per client | ~2 hours | Under 10 minutes |
I want to be precise about what this changed, because it’s not “automation replaced strategy.” It removed the clerical assembly work. I still had to explain why a dip happened in March, still had to recommend next steps, still had to use judgment about what mattered. The audit scoring itself still requires interpretation, same as it always did. What disappeared was the two hours of formatting that sat between “I know what happened” and “the client knows what happened.”
What Changed in the Client Relationship Once I Stopped Curating Slides
Clients started trusting the number more, not less, the moment they could see the same raw trendline I was looking at. There’s no selective framing in a live score history view. I’m not choosing which month’s screenshot looks best. I’m not writing around a flat quarter with optimistic language. The client sees exactly what I see, which, counterintuitively, builds more trust than a polished narrative ever did — because there’s nothing to second-guess.
Conversations got shorter and better at the same time. Less time spent walking through slide six, more time spent on “okay, given this, what do we do in April.” The call shifted from report delivery to actual strategy, which is the part clients are paying for anyway.
One honest caveat: this works best with clients who already trust your strategic judgment. A brand-new or skeptical client sometimes still wants the narrative context, at least for the first quarter or two, because they haven’t built the pattern-recognition yet to read a trendline cold. I still layer in a short written note for those accounts — this isn’t a replacement for the strategic conversation, just for the slide deck that used to precede it.
What Didn’t Change (and Why That’s Fine)
I didn’t stop reporting. I stopped assembling a redundant layer on top of reporting. The strategic calls still happen. The recommendations still happen. The context about algorithm updates, seasonal traffic dips, or a competitor’s new content push still gets communicated — just live, in conversation, instead of pre-written into bullet points nobody read.
Automation handled the “proof of movement” piece. That freed up the human part of reporting — the actual thinking — to happen in real time instead of getting buried under formatting work the week before.
How to Automate Your Own SEO Client Reports
If your Sunday nights look like mine used to, here’s the exact sequence I’d run on one account before rolling this out across your whole book of business:
- Audit your current deck and mark which sections clients actually reference on calls versus which ones you’re building out of habit.
- Identify what you’re manually tracking today that a tool like your SEO scoring system already tracks automatically in the background.
- Pick one retainer client — ideally a trusting, established one — and pilot the live score history conversation instead of the deck.
- Keep a short written note (three to four lines) for context a trendline can’t explain on its own, like an algorithm update or a seasonal dip.
- Compare how long the call takes and how it feels before rolling the change out to the rest of your accounts.
If you’re managing more than a handful of retainers, the multi-domain view most agency dashboards offer makes this even faster, since you’re not logging into separate tools per client to pull the same trendline.
The Deck Was Never the Deliverable
I used to think the deck was the report. It wasn’t. The report was always that one trendline, and I was just building forty minutes of padding around it to feel like I’d earned my fee. Cut the padding. Show the line. Have the actual conversation. If you’re still spending your Sunday nights formatting slides nobody reads, that time belongs in strategy work or new business outreach instead — and a tool built to track that movement automatically is a lot cheaper than another lost weekend.